Financial Highlights
Operating Results
Net sales
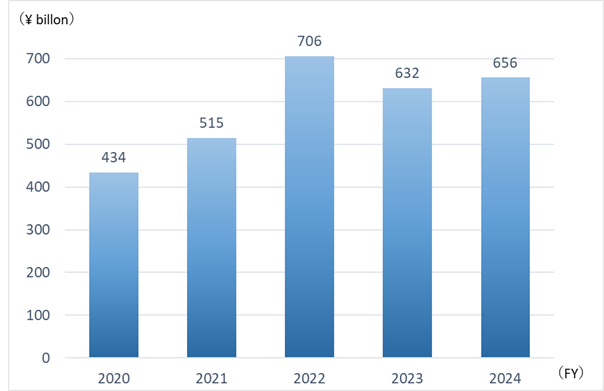
(¥ million)
| FY2020 | FY2021 | FY2022 | FY2023 | FY2024 |
|---|---|---|---|---|
|
△10.5% 434,776 |
+18.5% 515,313 |
+37.0% 706,073 |
△10.4% 632,985 |
+3.6% 656,010 |
- The figure on the upper-left means the rate of change from the previous year.
Operating income
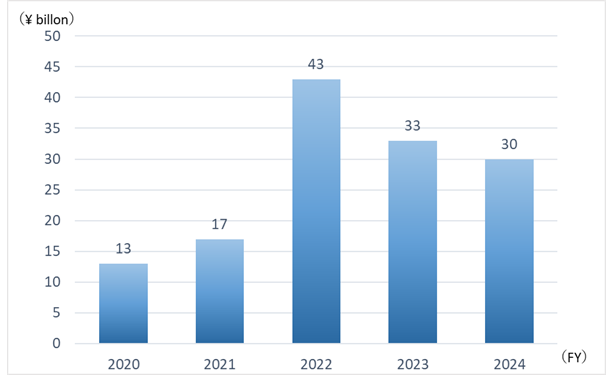
(¥ million)
| FY2020 | FY2021 | FY2022 | FY2023 | FY2024 |
|---|---|---|---|---|
|
△36.7% 13,515 |
+32.1% 17,858 |
+144.9% 43,743 |
△23.2% 33,597 |
△8.1% 30,887 |
- The figure on the upper-left means the rate of change from the previous year.
Ordinary income
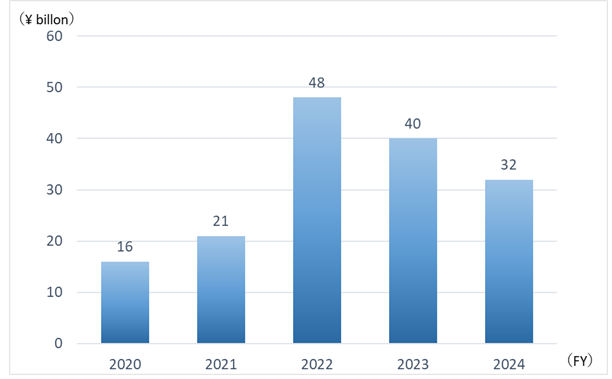
(¥ million)
| FY2020 | FY2021 | FY2022 | FY2023 | FY2024 |
|---|---|---|---|---|
|
△32.9% 16,622 |
+31.8% 21,912 |
+119.8% 48,171 |
△15.3% 40,797 |
△20.6% 32,412 |
- The figure on the upper-left means the rate of change from the previous year.
Net income attributable to owners of the parent
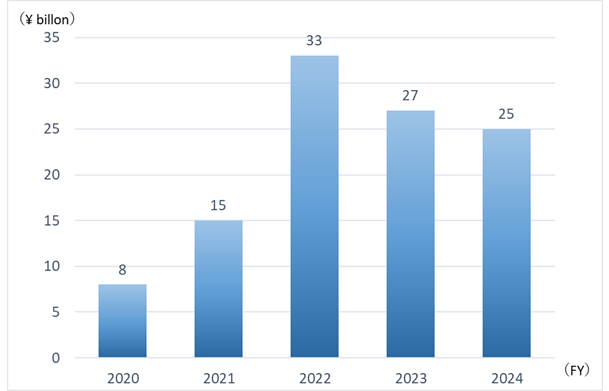
(¥ million)
| FY2020 | FY2021 | FY2022 | FY2023 | FY2024 |
|---|---|---|---|---|
|
△47.2% 8,592 |
+79.9% 15,459 |
+118.1% 33,721 |
△19.0% 27,304 |
△6.8% 25,454 |
- The figure on the upper-left means the rate of change from the previous year.