Financial Highlights
Financial Indicator
Return on assets[ROA]
![Graph:Return on assets[ROA]](/lang/en/corporate/financial/indicator/images/index-img01.png)
(%)
| FY2020 | FY2021 | FY2022 | FY2023 | FY2024 |
|---|---|---|---|---|
1.5 |
2.5 |
5.0 |
3.8 |
3.4 |
Return on assets[ROA]=Net income attributable to owners of the parent/Total assets(average)×100
Return on equity[ROE]
![Graph:Return on equity[ROE]](/lang/en/corporate/financial/indicator/images/index-img02.png)
(%)
| FY2020 | FY2021 | FY2022 | FY2023 | FY2024 |
|---|---|---|---|---|
2.5 |
4.2 |
8.6 |
6.4 |
5.6 |
Return on equity[ROE]=Net income attributable to owners of the parent/Shareholders' equity(average)×100
Return on sales
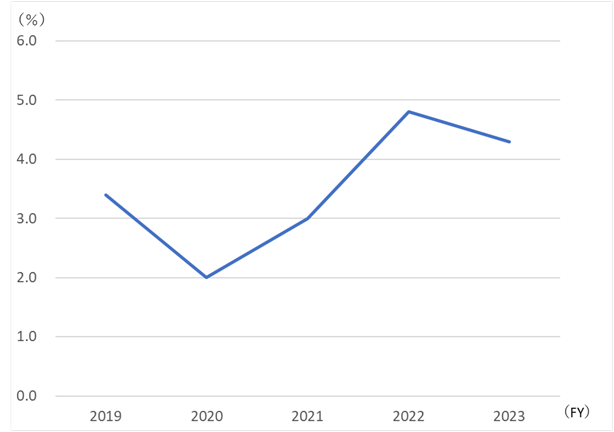
(%)
| FY2020 | FY2021 | FY2022 | FY2023 | FY2024 |
|---|---|---|---|---|
2.0 |
3.0 |
4.8 |
4.3 |
3.9 |
Return on sales=Net income attributable to owners of the parent/Sales×100
Total assets turnover
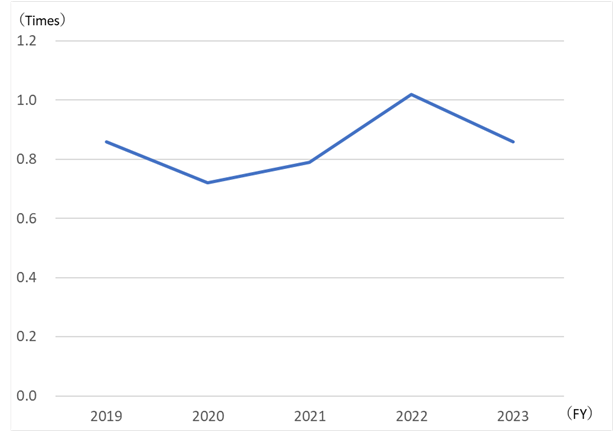
(Times)
| FY2020 | FY2021 | FY2022 | FY2023 | FY2024 |
|---|---|---|---|---|
0.72 |
0.79 |
1.02 |
0.86 |
0.86 |
Total assets=Sales/Total assets