Financial Highlights
Financial Standing
Total assets
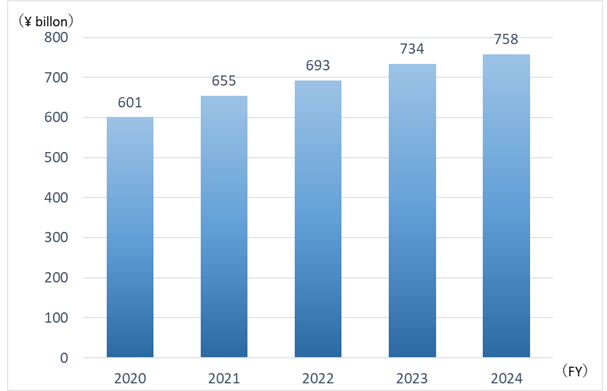
(¥ million)
| FY2018 | FY2019 | FY2020 | FY2021 | FY2022 |
|---|---|---|---|---|
|
+1.7% 550,599 |
+2.6% 564,756 |
+6.6% 601,835 |
+8.9% 655,593 |
+5.8% 693,519 |
- The figure on the upper-left means the rate of change from the previous year.
Net assets
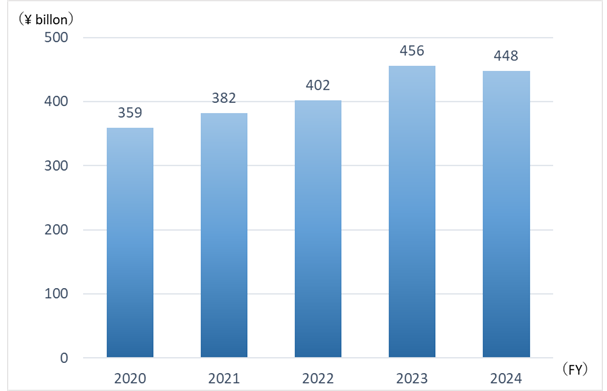
(¥ million)
| FY2018 | FY2019 | FY2020 | FY2021 | FY2022 |
|---|---|---|---|---|
|
+0.3% 327,339 |
△1.4% 322,768 |
+11.4% 359,492 |
+6.5% 382,751 |
+5.2% 402,502 |
- The figure on the upper-left means the rate of change from the previous year.
Interest-bearing debts
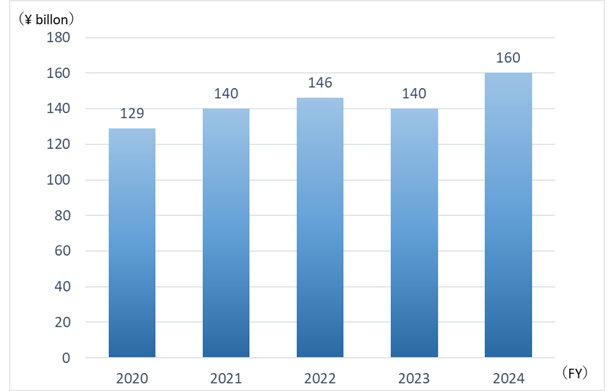
(¥ million)
| FY2018 | FY2019 | FY2020 | FY2021 | FY2022 |
|---|---|---|---|---|
|
+13.5% 127,298 |
+0.9% 128,495 |
+1.1% 129,922 |
+8.4% 140,830 |
+4.2% 146,683 |
- The figure on the upper-left means the rate of change from the previous year.
Equity ratio
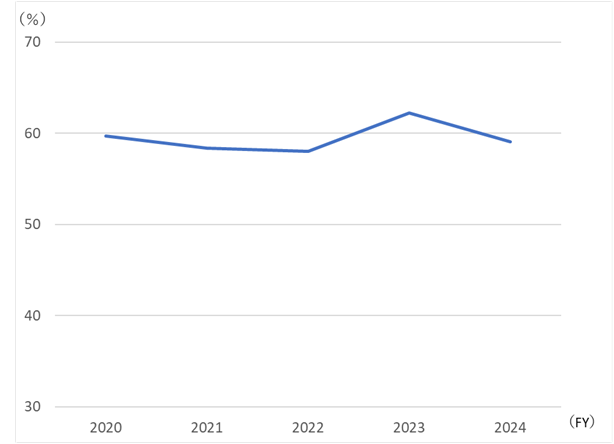
(%)
| FY2018 | FY2019 | FY2020 | FY2021 | FY2022 |
|---|---|---|---|---|
|
59.5 |
57.2 |
59.7 |
58.4 |
58.0 |
Equity ratio=Shareholders' equity/Total assets×100
Capital expenditures
(¥ million)
| FY2018 | FY2019 | FY2020 | FY2021 | FY2022 |
|---|---|---|---|---|
|
△12.7% 34,610 |
△3.0% 33,566 |
+2.2% 34,305 |
- 60,381 |
△0.3% 60,196 |
- The figure on the upper-left means the rate of change from the previous year.
- Including investments from FY2021
Depreciation and amortization
(¥ million)
| FY2018 | FY2019 | FY2020 | FY2021 | FY2022 |
|---|---|---|---|---|
|
+0.3% 36,075 |
+4.1% 37,557 |
△0.2% 37,463 |
△2.5% 36,510 |
△0.7% 36,268 |
- The figure on the upper-left means the rate of change from the previous year.